


Humboldt County Association of Governments
The Humboldt County Association of Governments (HCAOG) is a Joint Powers Agency composed of the seven incorporated cities (Arcata, Blue Lake, Eureka, Ferndale, Fortuna, Rio Dell, Trinidad), and the County of Humboldt. It is the designated Regional Transportation Planning Agency (RTPA) as well as the Service Authority for Freeway Emergencies (SAFE). The agency is largely responsible for programming State highway, local street and road improvements, public transportation resources, and the roadside call box program. HCAOG also bears responsibility for preparing and implementing the Regional Transportation Plan (RTP). The transportation planning and programming processes are accomplished by a multi-layered committee structure.
The HCAOG Board of Directors is composed of elected officials from the eight governing bodies in the region. The HCAOG Board is the final authority for all decisions generated in the region's transportation planning and programming arena.
Please visit our HCAOG Board of Directors page for meeting agendas and Board Member contact information.
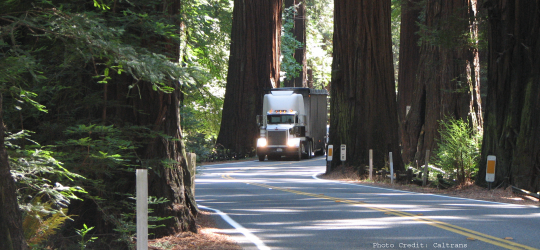
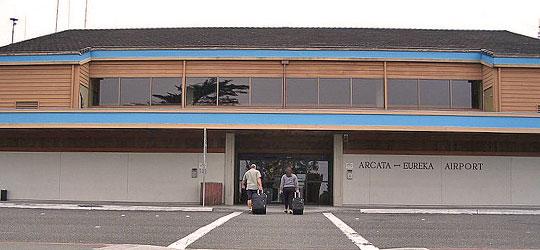
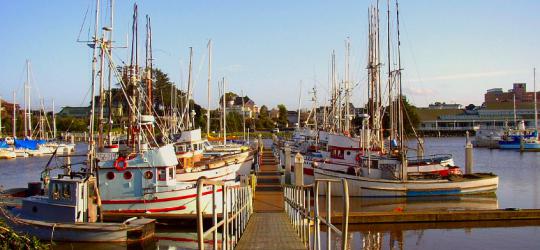
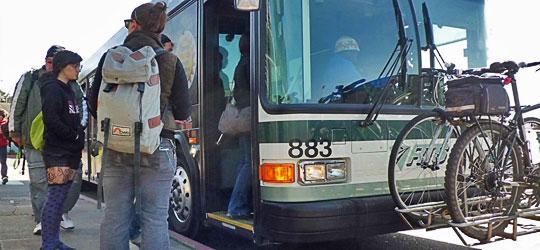
Mission Statement: To develop, operate, and maintain a well-coordinated, balanced, countywide multimodal transportation system that is safe, efficient, and provides good access to all cities, communities, and recreational facilities, and into adjoining regions. A balanced multimodal transportation system includes but is not limited to a highway, public transit, aviation, marine, railroads, recreation, bicycle, pedestrian, and utility systems.
AB 2040. Compensation of elected officials, officers, and employees: reporting and disclosure. In compliance with AB 2040, information on annual compensation of employees of HCAOG is available at https://publicpay.ca.gov/Reports/SpecialDistricts/SpecialDistrict.aspx?entityid=3471&year=2020